
Sites built with shadcn/ui
Radix-based React component library distributed as copy-paste source rather than installed as an npm dependency.
Found via: Product Hunt 11,545 · Hacker News 657 · PeerPush 1,648 · Other 18 · StackScope Discovery (Indie) 1,894 · StackScope Wider Web 2,022
Figures on this page reflect launches found via All sources only. The "Found via" counts above always show every source. Reset
shadcn/ui has been detected on 15,762 launches we've crawled, with 4082 of those in July 2026 (10.0% of the month's launches so far). The 7-day rolling share is 10.0%, up 1.0 percentage points from last week. Most recent detection: Regularly, today.
It's most commonly paired with Tailwind CSS, HSTS, and Google Search Console. By product type, the launches using it are most often AI (15%), Productivity (14%), and Marketing (14%). By estimated origin, the United States (23%) and India (20%) lead close together. By domain ending, launches using it are 2.3 times as likely as the average launch to live on a .digital domain.
What kind of products ship with shadcn/ui
11,677 launches
Countries that use shadcn/ui
Estimated origin for 4,090 of 15,762 launches
-
 United States
23.40%
United States
23.40%
-
 India
19.83%
India
19.83%
-
 United Kingdom
8.02%
United Kingdom
8.02%
-
 China
5.09%
China
5.09%
-
 Canada
3.74%
Canada
3.74%
-
 Germany
3.69%
Germany
3.69%
-
 France
3.40%
France
3.40%
-
 Netherlands
2.35%
Netherlands
2.35%
-
 Brazil
1.96%
Brazil
1.96%
-
 Australia
1.74%
Australia
1.74%
-
 Spain
1.69%
Spain
1.69%
-
 South Korea
1.52%
South Korea
1.52%
-
 Italy
1.47%
Italy
1.47%
-
 Poland
1.22%
Poland
1.22%
-
 Türkiye
1.20%
Türkiye
1.20%
Share of new launches using shadcn/ui
Each dot is one launch day. Line is the 7-day rolling average.
How StackScope detects technologies
⋮ Jul 1, 2026: Adoption figures now count launches from launch platforms. Use the source view to include StackScope Discovery.
⋮ Jul 9, 2026: Discovery (lite) crawls now run the structural checks; expect a step up from first-party launches
UI Library leaders
| Tool | % of launches | % of category | ||
|---|---|---|---|---|
| #1 |
shadcn/ui
Current page
|
16.87% | 58.35% | |
| #2 |
 Lucide Icons
|
16.19% | 56.00% | |
| #3 |
 Chakra UI
|
0.05% | 0.17% | |
| #4 |
 Flowbite
|
0.01% | 0.04% | |
| #5 |
 Tamagui
|
0.01% | 0.03% |
Percentages show adoption among launches found via All sources: the share of all such launches, and of those using any UI Library tool. All 26 in UI Library →
Often used with
| Tool | Launches |
|---|---|
 Tailwind CSS
|
14,937 |
| HSTS | 11,968 |
 Google Search Console
|
9,891 |
 Cloudflare
|
8,700 |
 Vite
Vite
|
7,742 |
Tools most often detected on the same launches as shadcn/ui.
Most recent of 15,762 launches using shadcn/ui found via All sources
 Regularly
Games
Regularly
Games




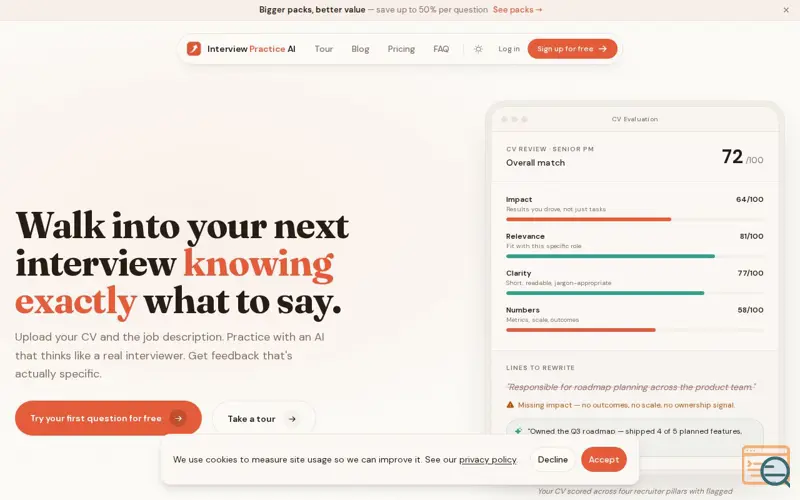 Interviewpracticeai
Hiring & HR
Interviewpracticeai
Hiring & HR


 PilotCite
AI
PilotCite
AI

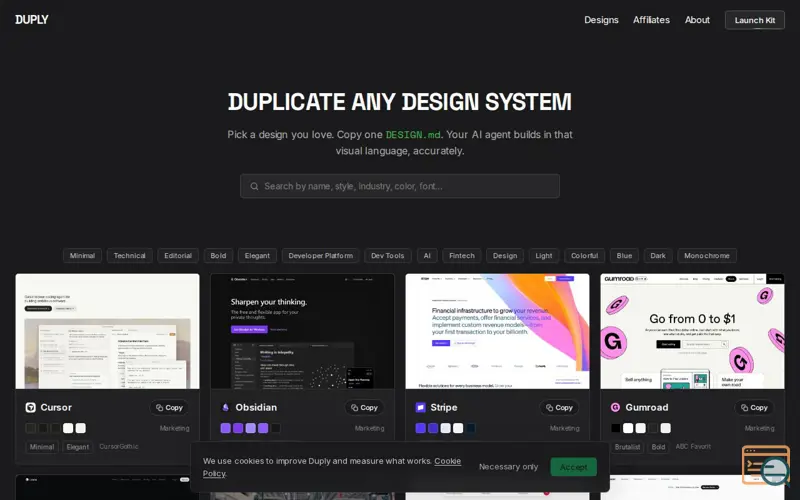 Duply
Duply
 Design

 CareerGini
Hiring & HR
CareerGini
Hiring & HR



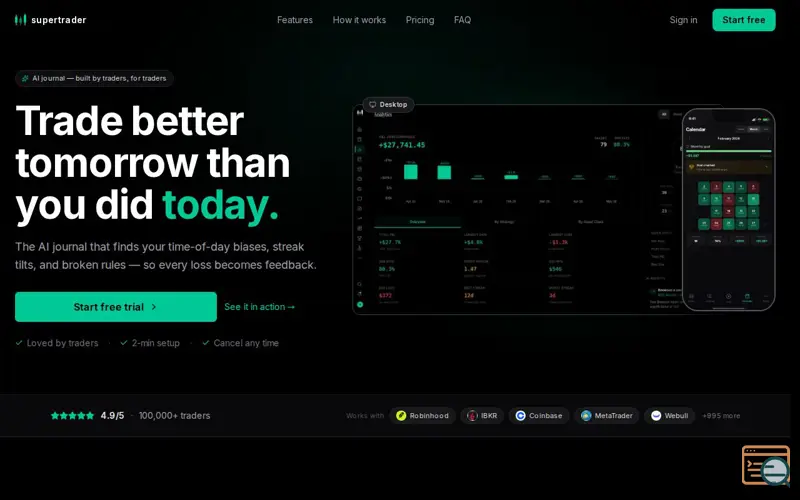 SuperTrader
Finance
SuperTrader
Finance

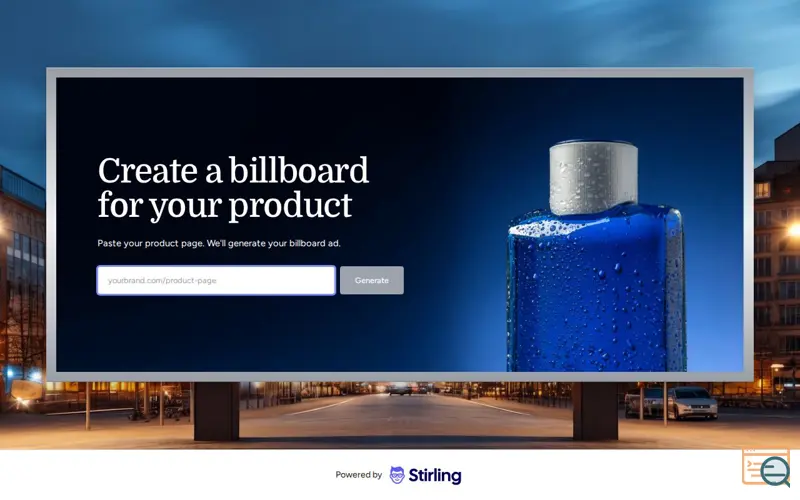 CheckOutMyBillboard.com
Marketing
CheckOutMyBillboard.com
Marketing



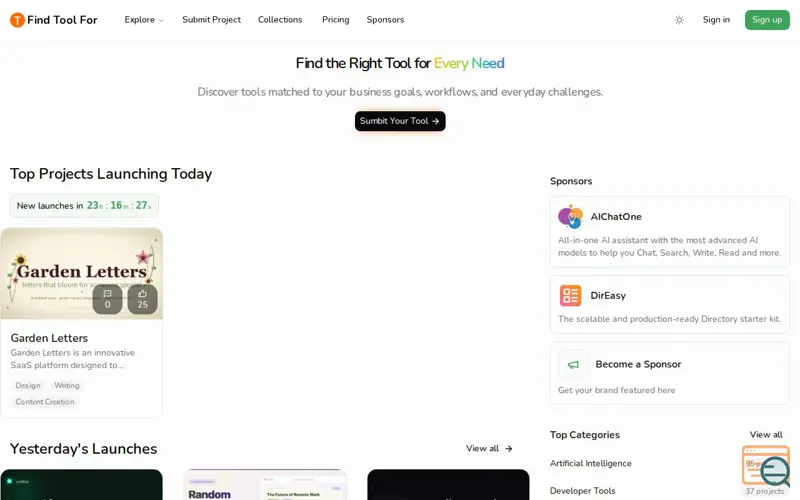 Find Tool For
Directory
Find Tool For
Directory
 KanBanPRO — Finish Every Task.
Productivity
KanBanPRO — Finish Every Task.
Productivity

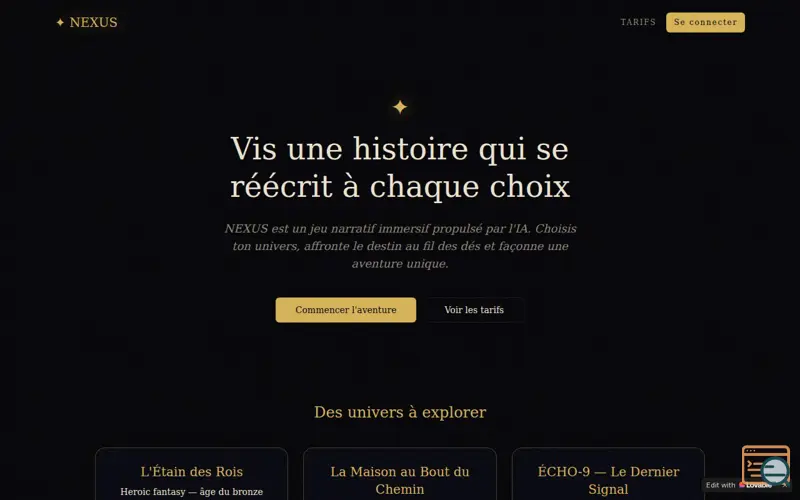 ✦ NEXUS
Games
✦ NEXUS
Games

 SiraPay
Finance
SiraPay
Finance

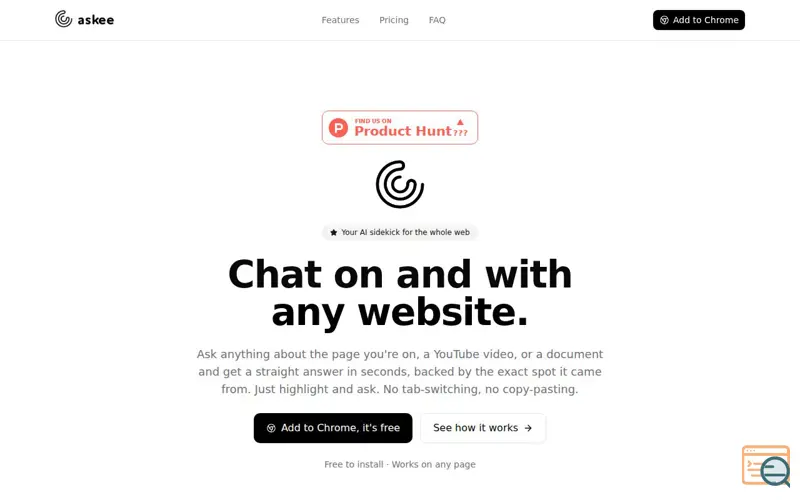 Askee
Productivity
Askee
Productivity

Showing the most recent 12 of 15,762 found via All sources.