
Sites using Anam
Real-time interactive AI avatar and digital human API.
3 sites
1 found by StackScope, 2 via launch platforms
- StackScope Wider Web 1
- Product Hunt 2
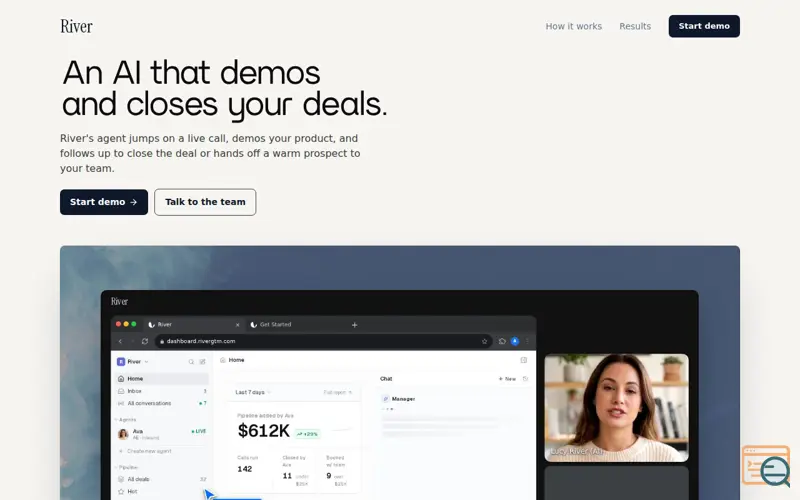
Anam has been detected on 3 launches since first appearing in June 2026. Most recent detection: River, on August 12, 2026.
It's most commonly paired with Lucide Icons, Tailwind CSS, and HSTS.
Share of new sites using Anam
Each dot is one launch day. Line is the 7-day rolling average. Chart starts at first detection.
The shaded part of the chart is measured against a different set of sites. Until 8 July 2026 we only tracked launches from launch platforms; from that date we crawl the wider web as well. The share is a proportion of whatever we were tracking at the time, so it can step at that line without the technology itself changing. For a single continuous measure, switch to launch platforms.
AI Agent leaders
| Tool | % of launches | % of category | ||
|---|---|---|---|---|
| #1 | ▲1 | WebMCP | 1.13% | 94.28% |
| #2 | ▼1 |
 Chatbase
|
0.01% | 0.84% |
| #3 | ▼1 | MetaGPT | 0.01% | 0.66% |
| #4 | ▼2 | GreenCore CPG Knowledge Graph | 0.01% | 0.49% |
| #5 | ▲3 |
 Decagon
|
<0.01% | 0.40% |
| … | ||||
| #73 | ▼65 |
Anam
Current page
|
<0.01% | 0.01% |
Percentages show adoption among indie launches: the share of all analysed launches, and of launches using any AI Agent tool.Among August launches it ranked #111 in AI Agent, down from #46 in July. All 395 in AI Agent →
Often used with
| Tool | Sites |
|---|---|
 Lucide Icons
|
3 |
 Tailwind CSS
|
3 |
| HSTS | 3 |
 Vercel
|
2 |
 Cloudflare
|
2 |
Tools most often detected on the same sites as Anam.
Recent launches we can show
2 of the 3 sites using Anam are product launches we list individually. The other 1 are sites we found crawling the wider web: they count towards the figures above, but we do not publish them one by one. How StackScope Discovery works






The StackScope API serves all 3 sites using Anam, filterable and exportable, from £15 a month.