
Sites using BacklinkLog
Directory that lists products and startups and issues backlink badges to listed sites.
12 sites
4 found by StackScope, 8 via launch platforms
- StackScope Wider Web 3
- StackScope Discovery (Indie) 1
- Product Hunt 7
- PeerPush 1
BacklinkLog has been detected on 12 launches we've crawled. Most recent detection: EnvDesk, on August 29, 2026.
It's most commonly paired with Cloudflare, Google Search Console, and Tailwind CSS.
Domain endings using BacklinkLog
12 sites
- .app 16.67%
- .com 16.67%
- .ai 8.33%
- .co 8.33%
- .dev 8.33%
- .net 8.33%
- .online 8.33%
- .org 8.33%
- .site 8.33%
- .tech 8.33%
Share of new sites using BacklinkLog
Each dot is one launch day. Line is the 7-day rolling average; weekly averages before June 2026. Chart starts at first detection.
The shaded part of the chart is measured against a different set of sites. Until 8 July 2026 we only tracked launches from launch platforms; from that date we crawl the wider web as well. The share is a proportion of whatever we were tracking at the time, so it can step at that line without the technology itself changing. For a single continuous measure, switch to launch platforms.
Directory leaders
| Tool | % of launches | % of category | ||
|---|---|---|---|---|
| #1 | – |
 Product Hunt
|
0.12% | 32.24% |
| #2 | ▲4 |
 TradeIndia
|
0.03% | 8.75% |
| #3 | – |
 ExportersIndia
|
0.03% | 7.52% |
| #4 | – |
 Fazier
|
0.03% | 7.49% |
| #5 | ▼2 |
 Startup Fame
|
0.02% | 6.82% |
| … | ||||
| #229 | ▼22 |
BacklinkLog
Current page
|
<0.01% | 0.09% |
Percentages show adoption among indie launches: the share of all analysed launches, and of launches using any Directory tool.Among August launches it ranked #290 in Directory, down from #268 in July. All 1020 in Directory →
Often used with
| Tool | Sites |
|---|---|
 Cloudflare
|
10 |
 Google Search Console
|
8 |
 Tailwind CSS
|
8 |
 Next.js
|
7 |
 React
React
|
7 |
Tools most often detected on the same sites as BacklinkLog.
Recent launches we can show
9 of the 12 sites using BacklinkLog are product launches we list individually. The other 3 are sites we found crawling the wider web: they count towards the figures above, but we do not publish them one by one. How StackScope Discovery works

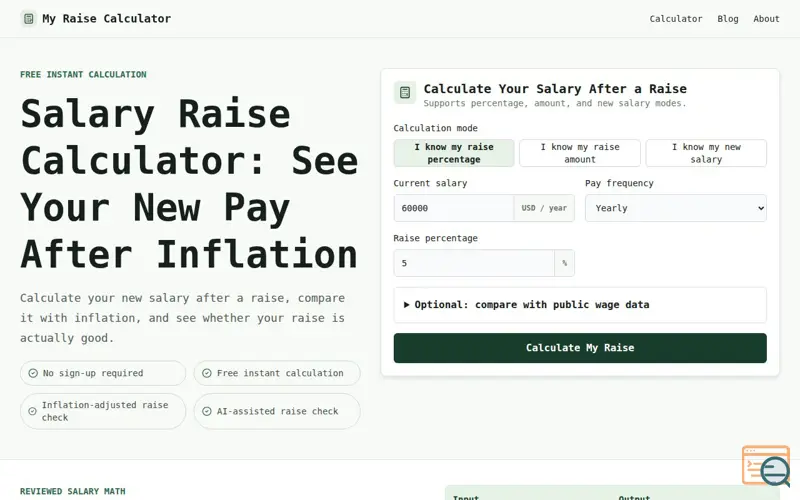 My Raise Calculator
Hiring & HR
My Raise Calculator
Hiring & HR
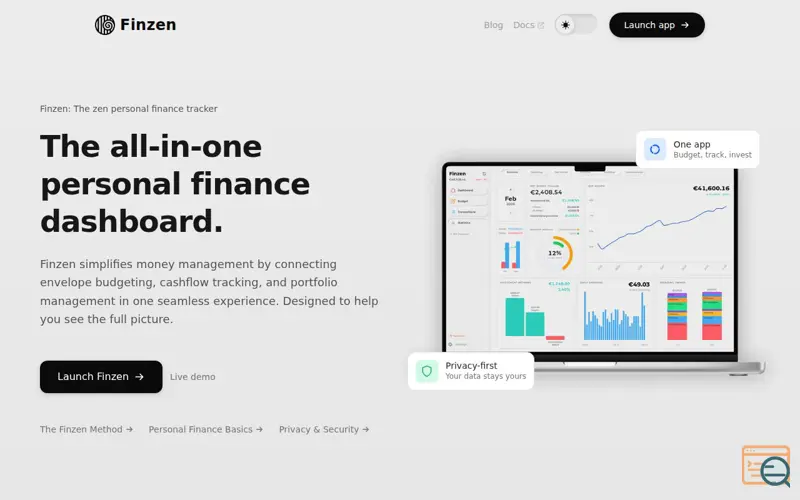 Finzen
Finance
Finzen
Finance



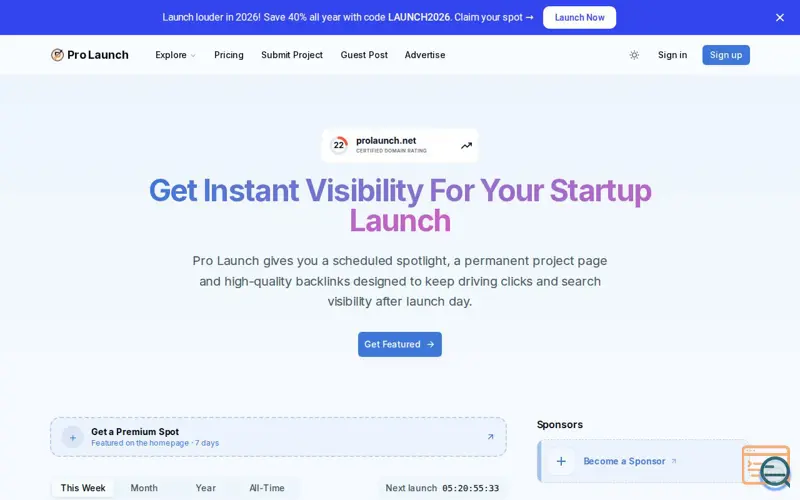 Pro Launch


 Phantom Chat

 TidyApp
Productivity
SpeakIQ App
Education
TidyApp
Productivity
SpeakIQ App
Education
 Pixal3D
Design
Pixal3D
Design
 Qr Studio


The StackScope API serves all 12 sites using BacklinkLog, filterable and exportable, from £15 a month.