FRED (St. Louis Fed) on new websites
FRED: Federal Reserve Economic Data API from the St. Louis Fed, providing free access to US and global economic time series.
24 sites
16 found by StackScope, 8 via launch platforms
- StackScope Discovery (Indie) 12
- StackScope Wider Web 4
- Product Hunt 7
- PeerPush 1
FRED (St. Louis Fed) appeared on 3 new sites in the last 30 days.
These figures cover websites that went live since April 2026, not the web as a whole.
Share of new sites using FRED (St. Louis Fed)
Each dot is one launch day. Line is the 7-day rolling average; weekly averages before July 2026.
The shaded areas were measured against a different set of sites, so the line can step there without FRED (St. Louis Fed) itself changing.
Coverage details
Before the dashed line where the dots begin, the line is a weekly average. After it, the last 90 days are shown one day at a time.
Grey: before 8 July 2026, we only tracked launches from launch platforms. From that date we crawl the wider web as well.
Amber: 8 July to 10 September 2026, before we improved our infrastructure to index new sites much sooner, often on the day they go live. Sites found that early often haven't finished setting up, so anything usually added after launch reads lower from 10 September. We record each site as it was when we found it.
The share is a proportion of whatever we were tracking at the time. For a single continuous measure, switch to launch platforms.
What kind of sites use FRED (St. Louis Fed)
21 sites with a known type, all time
Domain endings using FRED (St. Louis Fed)
24 sites, all time
- .com 58.3%
- .ai 12.5%
- .app 8.3%
- .org 8.3%
Data API leaders
| Tool | % of sitesall time | % of categoryall time | ||
|---|---|---|---|---|
| #1 | – |
 LocalLogic
|
0.1% | 23.1% |
| #2 | ▼1 |
 The Movie Database
|
<0.1% | 6.7% |
| #3 | ▲1 |
 Daum Postcode
|
<0.1% | 5.4% |
| #4 | ▼1 |
 ViaCEP
|
<0.1% | 3.5% |
| #5 | ▼1 |
 Frankfurter
|
<0.1% | 3.2% |
| … | ||||
| #92 | ▼165 | FRED (St. Louis Fed) Current page | <0.1% | 0.2% |
Percentages show all-time adoption across the new sites we track: the share of all of them, and of the sites using any Data API tool.Among September launches it ranked #236 in Data API, down from #71 in August. All 1488 in Data API →
Recent launches using FRED (St. Louis Fed)
20 of the 24 sites using FRED (St. Louis Fed) are product launches we list individually. The other 4 are sites we found crawling the wider web: they count towards the figures above, but we do not publish them one by one. They are included in the StackScope API and in Stackdar alerts. How StackScope Discovery works




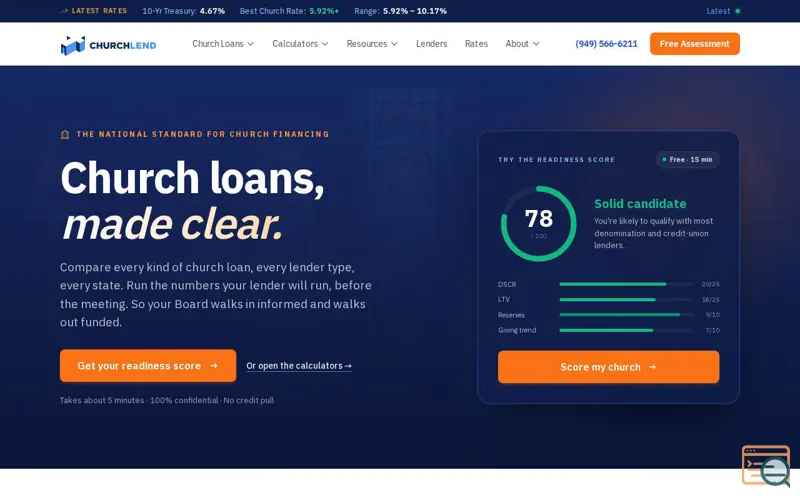 ChurchLend
Aug 31, 2026 · score 10.0 ·
ChurchLend
Aug 31, 2026 · score 10.0 ·  Finance
Also detected
Finance
Also detected



 MacroWombat(マクロウォンバット)| 米連邦準備制度・日本銀行・米国株SEC開示をリアルタイムで確認
Also detected
MacroWombat(マクロウォンバット)| 米連邦準備制度・日本銀行・米国株SEC開示をリアルタイムで確認
Also detected

 CalcScrape — Free Cost Calculators with Live .Gov Pricing
Also detected
CalcScrape — Free Cost Calculators with Live .Gov Pricing
Also detected


 Gold Intelligence — Live Gold Price, Central Bank Data & Buying Guides
Also detected
Gold Intelligence — Live Gold Price, Central Bank Data & Buying Guides
Also detected
 Fortress Finance — The Risk Terminal for Crypto-Native Traders
Also detected
Fortress Finance — The Risk Terminal for Crypto-Native Traders
Also detected

 Skopia — Vois ce qui compte dans le monde
Also detected
Skopia — Vois ce qui compte dans le monde
Also detected


 Free AI Small Business Financial Analysis & Forecast Tool — ClaritySMEFinance
Also detected
Free AI Small Business Financial Analysis & Forecast Tool — ClaritySMEFinance
Also detected



 AI-native, honest, explainable research for retail investors
Also detected
FX Forge — FX & Financial Intelligence
Also detected
Signum Lab - Stock Momentum Scanner & Macro Dashboard
Also detected
AI-native, honest, explainable research for retail investors
Also detected
FX Forge — FX & Financial Intelligence
Also detected
Signum Lab - Stock Momentum Scanner & Macro Dashboard
Also detected

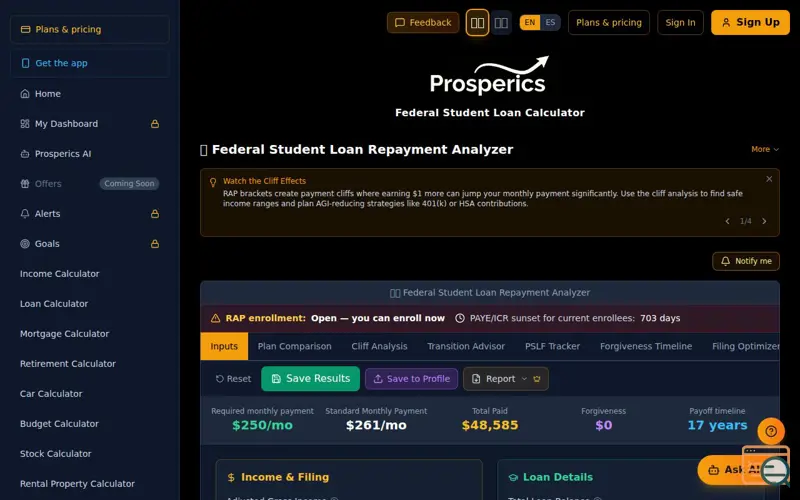 Prosperics RAP Calculator
Also detected
Prosperics RAP Calculator
Also detected

Showing the most recent 12 of 20.
The StackScope API serves all 24 sites using FRED (St. Louis Fed), filterable and exportable, from £15 a month.