
Kie.ai on new websites
Unified AI API platform that routes requests to many third-party generative models through a single interface.
29 sites
18 found by StackScope, 11 via launch platforms
- StackScope Discovery (Indie) 16
- StackScope Wider Web 2
- Product Hunt 10
- Other 1
Kie.ai appeared on 5 new sites in the last 30 days.
These figures cover websites that went live since April 2026, not the web as a whole.
Get told when a new site ships with Kie.ai.
5 new sites with Kie.ai first seen in the last 30 days.
Stackdar watches every launch we detect and sends you the ones using Kie.ai, by email, Slack or webhook. On every plan, from £15 a month.
See how alerts workShare of new sites using Kie.ai
Each dot is one launch day. Line is the 7-day rolling average; weekly averages before July 2026.
Before the dashed line where the dots begin, the line is a weekly average. After it, the last 90 days are shown one day at a time.
The shaded parts of the chart are measured against a different set of sites.
Grey: before 8 July 2026, we only tracked launches from launch platforms. From that date we crawl the wider web as well.
Amber: 8 July to 10 September 2026, before we improved our infrastructure to index new sites much sooner, often on the day they go live. Sites found that early often haven't finished setting up, so anything usually added after launch reads lower from 10 September. We record each site as it was when we found it.
The share is a proportion of whatever we were tracking at the time, so it can step at these lines without the technology itself changing. For a single continuous measure, switch to launch platforms.
What kind of products ship with Kie.ai
21 sites with a known product type, all time
Domain endings using Kie.ai
29 sites, all time
- .ai 24.14%
- .app 24.14%
- .com 17.24%
- .net 10.34%
- .fr 6.90%
- .io 6.90%
AI API leaders
| Tool | % of sites, all time | % of category, all time | ||
|---|---|---|---|---|
| #1 | ▼1 |
 Anthropic
|
0.07% | 25.83% |
| #2 | – |
 Abacus.AI
|
0.06% | 20.92% |
| #3 | ▲1 |
 OpenAI API
|
0.06% | 20.26% |
| #4 | – |
 Google Gemini API
|
0.03% | 10.01% |
| #5 | – | One API | 0.02% | 5.45% |
| … | ||||
| #35 | ▲2 |
Kie.ai
Current page
|
<0.01% | 0.19% |
Percentages show all-time adoption across the new sites we track: the share of all of them, and of the sites using any AI API tool.Among September launches it ranked #45 in AI API, up from #47 in August. All 198 in AI API →
Recent launches using Kie.ai
27 of the 29 sites using Kie.ai are product launches we list individually. The other 2 are sites we found crawling the wider web: they count towards the figures above, but we do not publish them one by one. They are included in the StackScope API and in Stackdar alerts. How StackScope Discovery works



 EasyInterior — Transform Any Space with AI
Also detected
EasyInterior — Transform Any Space with AI
Also detected


 VYRIO — AI Viral Content Studio (images, videos, Short Drama, ads)
Content
Also detected
VYRIO — AI Viral Content Studio (images, videos, Short Drama, ads)
Content
Also detected



 Lyrics to Song AI – Turn Your Lyrics Into Full Songs
Content
Also detected
Lyrics to Song AI – Turn Your Lyrics Into Full Songs
Content
Also detected


 MotionForge — Votre studio de création image et vidéo IA
Also detected
MotionForge — Votre studio de création image et vidéo IA
Also detected
 VinTech · Une photo, une annonce Vinted prête
Also detected
LoveMusic — Free Online Music Tools
Content
Also detected
VinTech · Une photo, une annonce Vinted prête
Also detected
LoveMusic — Free Online Music Tools
Content
Also detected
 UnPrank – Piège tes amis avec des montages photo IA réalistes
Also detected
Luminarot — A tarot journal that reflects, not predicts
Also detected
UnPrank – Piège tes amis avec des montages photo IA réalistes
Also detected
Luminarot — A tarot journal that reflects, not predicts
Also detected
 Fluxdock — your AI tools, on one canvas
AI
Also detected
Fluxdock — your AI tools, on one canvas
AI
Also detected
 Mona Lisa Img
AI
Also detected
Mona Lisa Img
AI
Also detected


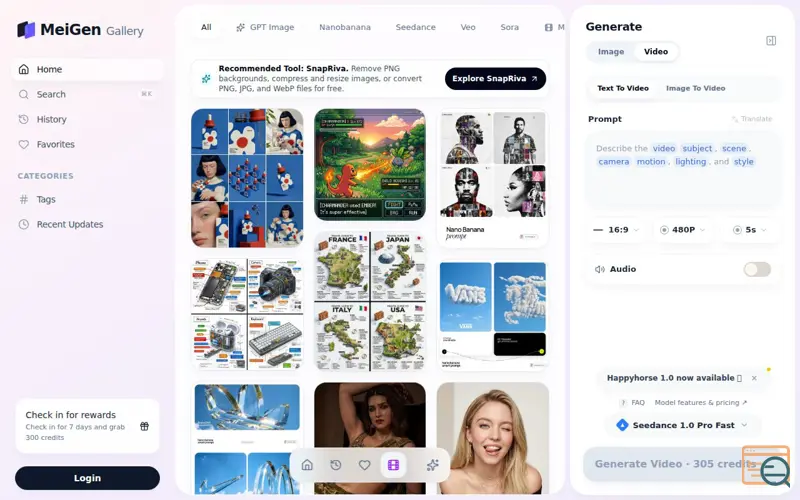 MeiGen AI
AI
Also detected
MeiGen AI
AI
Also detected

Showing the most recent 12 of 27.
The StackScope API serves all 29 sites using Kie.ai, filterable and exportable, from £15 a month.