
Sites built with Cleave.js
JavaScript library for formatting text in input fields.
Get told when a new site ships with Cleave.js.
Stackdar watches every launch we detect and sends you the ones using Cleave.js, by email, Slack or webhook. On every plan, from £15 a month.
See how alerts work200 sites
198 found by StackScope, 2 via launch platforms
- StackScope Wider Web 190
- StackScope Discovery (Indie) 8
- Product Hunt 2
Cleave.js has been detected on 200 launches we've crawled, with 20 of those in September 2026 (0.0% of the month's launches so far). The 7-day rolling share is 0.0%, roughly steady week on week. Most recent detection: link101, today.
It's most commonly paired with Cloudflare, jQuery, and Google Fonts. By product type, the launches using it are most often Health (28%), E-commerce (26%), and Finance (15%).
What kind of products ship with Cleave.js
46 launches
Domain endings using Cleave.js
200 sites
- .com 56.50%
- .online 6.00%
- .ca 3.50%
- .site 3.50%
- .in 3.00%
- .store 3.00%
- .us 3.00%
- .co 2.50%
- .org 2.50%
- .uk 2.50%
- .ch 1.50%
Country
29 of 200 sites, where we are semi-confident of the country.
-
 United Kingdom
17.24%
United Kingdom
17.24%
-
 United States
17.24%
United States
17.24%
-
 India
10.34%
India
10.34%
-
 Brazil
6.90%
Brazil
6.90%
-
 Canada
6.90%
Canada
6.90%
-
 Switzerland
6.90%
Switzerland
6.90%
-
 Germany
6.90%
Germany
6.90%
-
 Slovakia
6.90%
Slovakia
6.90%
-
 United Arab Emirates
3.45%
United Arab Emirates
3.45%
-
 France
3.45%
France
3.45%
-
 Mexico
3.45%
Mexico
3.45%
Share of new sites using Cleave.js
Each dot is one launch day. Line is the 7-day rolling average. Chart starts at first detection.
The shaded part of the chart is measured against a different set of sites. Until 8 July 2026 we only tracked launches from launch platforms; from that date we crawl the wider web as well. The share is a proportion of whatever we were tracking at the time, so it can step at that line without the technology itself changing. For a single continuous measure, switch to launch platforms.
Javascript Library leaders
| Tool | % of launches | % of category | ||
|---|---|---|---|---|
| #1 | – |
 jQuery
|
14.31% | 34.50% |
| #2 | – |
 React Router
|
6.76% | 16.30% |
| #3 | – |
 Motion
|
6.67% | 16.07% |
| #4 | – |
 TanStack Router
|
4.24% | 10.23% |
| #5 | – |
 Swiper
|
3.62% | 8.72% |
| … | ||||
| #217 | ▲12 |
Cleave.js
Current page
|
0.01% | 0.02% |
Percentages show adoption among indie launches: the share of all analysed launches, and of launches using any Javascript Library tool.Among August launches it ranked #211 in Javascript Library, up from #223 in July. All 1098 in Javascript Library →
Often used with
| Tool | Sites |
|---|---|
 Cloudflare
|
120 |
|
jQuery
|
116 |
 Google Fonts
|
102 |
| HTTP/3 | 101 |
| HSTS | 83 |
Tools most often detected on the same sites as Cleave.js.
Recent launches we can show
10 of the 200 sites using Cleave.js are product launches we list individually. The other 190 are sites we found crawling the wider web: they count towards the figures above, but we do not publish them one by one. How StackScope Discovery works
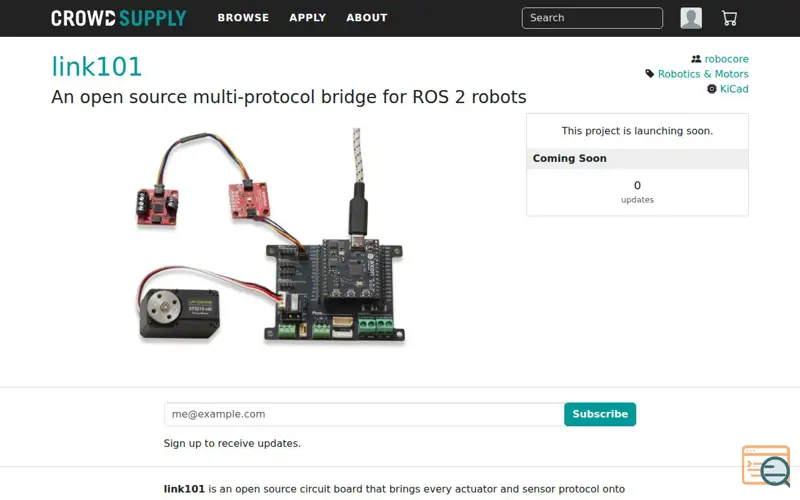 link101
Developer Tools
link101
Developer Tools


 uTenantmatch | The Warehousing Matchmaker | uTenantmatch



 Expédiez votre courrier recommandé A/R depuis votre domicile avec Lettresresil


 Dindili - Histórias Infantis Personalizadas Todos os Dias
 Finden statt suchen: Die smarte Suchmaschine – zip2.ch
Hiring & HR
Finden statt suchen: Die smarte Suchmaschine – zip2.ch
Hiring & HR
 SKOS Cloud | AI Business OS for Traders, Wholesalers & SMEs
Productivity
SKOS Cloud | AI Business OS for Traders, Wholesalers & SMEs
Productivity



 Portu - Lepšie miesto pre peniaze
Finance
Portu - Lepšie miesto pre peniaze
Finance




 Here to Help You Write Your Letters
Productivity
Here to Help You Write Your Letters
Productivity
 Wozzim - Car Wash · Garage · Laundry Platform
Productivity
Wozzim - Car Wash · Garage · Laundry Platform
Productivity

 Check, Verify & Validate BIN - Bank Identification Number
Finance
Check, Verify & Validate BIN - Bank Identification Number
Finance
The StackScope API serves all 200 sites using Cleave.js, filterable and exportable, from £15 a month.