
Sites using Glyphex
Llightweight, privacy-first website analytics.
11 sites
8 found by StackScope, 3 via launch platforms
- StackScope Discovery (Indie) 8
- Product Hunt 3
Glyphex has been detected on 11 launches we've crawled, with 7 of those in August 2026 (0.0% of the month's launches so far). Most recent detection: ChordFrog, yesterday.
It's most commonly paired with Tailwind CSS, Google Search Console, and Resend.
Domain endings using Glyphex
11 sites
- .app 45.45%
- .com 27.27%
- .me 9.09%
- .net 9.09%
- .site 9.09%
Share of new sites using Glyphex
Each dot is one launch day. Line is the 7-day rolling average; weekly averages before May 2026.
The shaded part of the chart is measured against a different set of sites. Until 8 July 2026 we only tracked launches from launch platforms; from that date we crawl the wider web as well. The share is a proportion of whatever we were tracking at the time, so it can step at that line without the technology itself changing. For a single continuous measure, switch to launch platforms.
How StackScope detects technologies
⋮ Jul 1, 2026: Adoption figures now count launches from launch platforms. Use the source view to include StackScope Discovery.
Analytics leaders
| Tool | % of launches | % of category | ||
|---|---|---|---|---|
| #1 | – |
 Google Analytics
|
12.04% | 46.73% |
| #2 | ▲6 |
 Tinybird
|
3.64% | 14.14% |
| #3 | ▲1 |
 Cloudflare Web Analytics
|
2.92% | 11.32% |
| #4 | ▲7 |
 Sourcebuster
|
2.30% | 8.91% |
| #5 | ▲1 |
 Vercel Analytics
|
2.18% | 8.46% |
| … | ||||
| #230 | ▼155 |
Glyphex
Current page
|
<0.01% | <0.01% |
Percentages show adoption among indie launches: the share of all analysed launches, and of launches using any Analytics tool.Among July launches it ranked #251 in Analytics, down from #96 in June. All 985 in Analytics →
Often used with
| Tool | Launches |
|---|---|
 Tailwind CSS
|
3 |
 Google Search Console
|
2 |
 Resend
|
2 |
 Cloudflare DNS
|
2 |
 Vercel
|
2 |
Tools most often detected on the same launches as Glyphex.
Recent launches we can show
11 of the 11 sites using Glyphex are product launches we list individually.
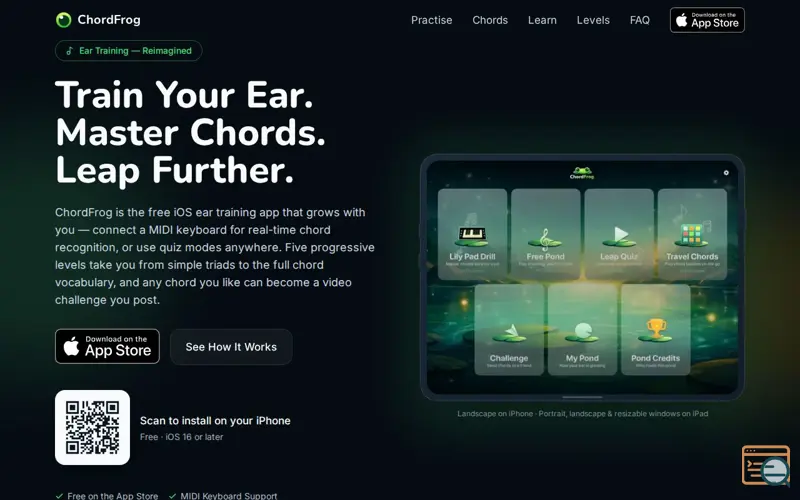 ChordFrog
Education
ChordFrog
Education

 Vidona — nearby transit departures on iPhone
 Nibpond — Draw it. Watch it move.
Design
Nibpond — Draw it. Watch it move.
Design
 Zaelona — The urge passes.
Health
Shale: Block Distracting Apps and Earn Your Scroll
Education
Zaelona — The urge passes.
Health
Shale: Block Distracting Apps and Earn Your Scroll
Education

 Athletickle — Algorithm-Driven Strength Training
Health
Athletickle — Algorithm-Driven Strength Training
Health


 CardCard
PatchPond — Learn synths by making sounds
Education
Pay once. Yours forever. Take it anywhere. · lastupdate.site
Developer Tools
CardCard
PatchPond — Learn synths by making sounds
Education
Pay once. Yours forever. Take it anywhere. · lastupdate.site
Developer Tools
 Plumerie: Home Library App
 Productivity

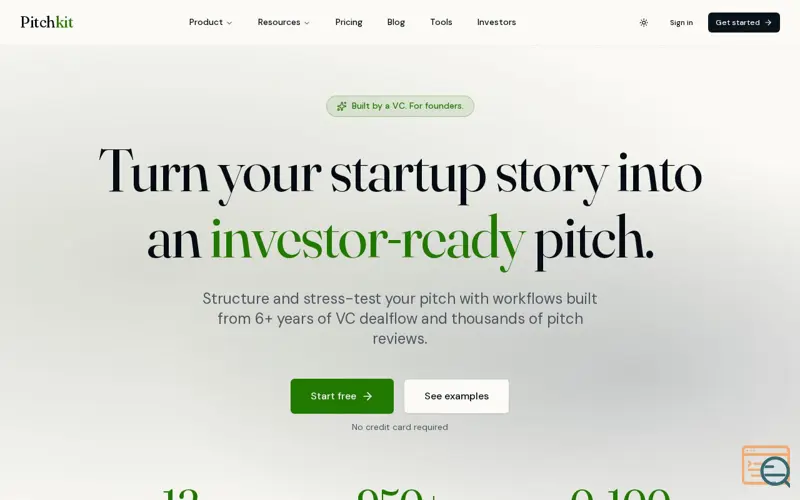 Pitchkit