Sites using Profitable CPM Rate Network
Programmatic CPM ad network for publishers monetising display traffic.
Get told when a new site ships with Profitable CPM Rate Network.
Stackdar watches every launch we detect and sends you the ones using Profitable CPM Rate Network, by email, Slack or webhook. On every plan, from £15 a month.
See how alerts work67 sites
6 found by StackScope, 61 via launch platforms
- StackScope Wider Web 6
- Product Hunt 58
- PeerPush 3
Profitable CPM Rate Network has been detected on 67 launches we've crawled. The 7-day rolling share is 0.0%, roughly steady week on week. Most recent detection: TempFreeMail: Disposable Email, yesterday.
It's most commonly paired with Google Search Console, Google Analytics, and HSTS. By product type, the launches using it are most often Productivity (33%), Games (17%), and Content (15%). The 61 scored launches using Profitable CPM Rate Network average a StackScope score of 5.9 out of 10, against 6.4 across all launches we score.
What kind of products ship with Profitable CPM Rate Network
48 launches
Domain endings using Profitable CPM Rate Network
67 sites
- .com 37.31%
- .app 26.87%
- .dev 4.48%
- .online 4.48%
- .xyz 4.48%
- .in 2.99%
- .org 2.99%
- .cc 1.49%
- .co 1.49%
- .fyi 1.49%
- .id 1.49%
Share of new sites using Profitable CPM Rate Network
Each dot is one launch day. Line is the 7-day rolling average; weekly averages before June 2026.
The shaded part of the chart is measured against a different set of sites. Until 8 July 2026 we only tracked launches from launch platforms; from that date we crawl the wider web as well. The share is a proportion of whatever we were tracking at the time, so it can step at that line without the technology itself changing. For a single continuous measure, switch to launch platforms.
Often used with
| Tool | Sites |
|---|---|
 Google Search Console
|
39 |
 Google Analytics
|
37 |
| HSTS | 37 |
 Google Fonts
|
34 |
 Tailwind CSS
|
34 |
Tools most often detected on the same sites as Profitable CPM Rate Network.
Recent launches we can show
61 of the 67 sites using Profitable CPM Rate Network are product launches we list individually. The other 6 are sites we found crawling the wider web: they count towards the figures above, but we do not publish them one by one. How StackScope Discovery works
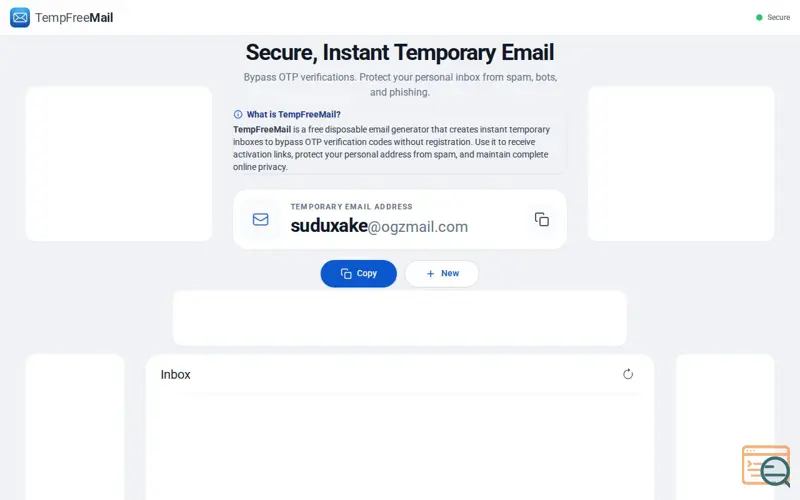 TempFreeMail: Disposable Email
Productivity
TempFreeMail: Disposable Email
Productivity



 LevelWalks
 Games
Games




 Text to Speech – Online Tool
AI
Text to Speech – Online Tool
AI



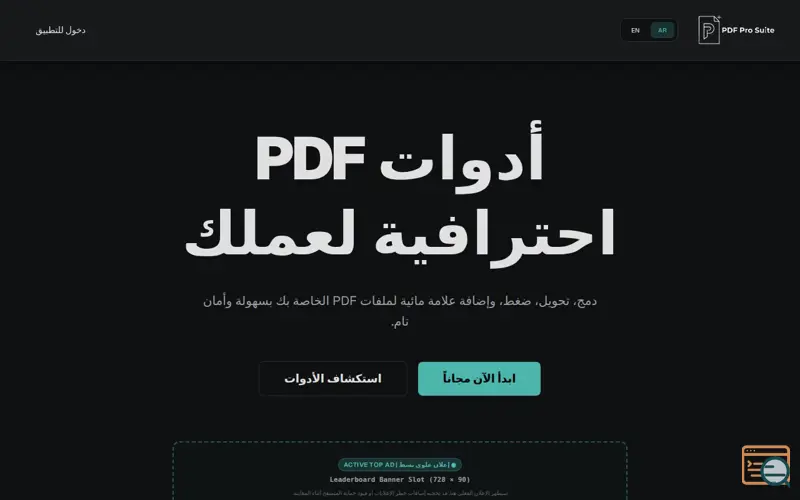 PDF Pro Suite
Productivity
PDF Pro Suite
Productivity


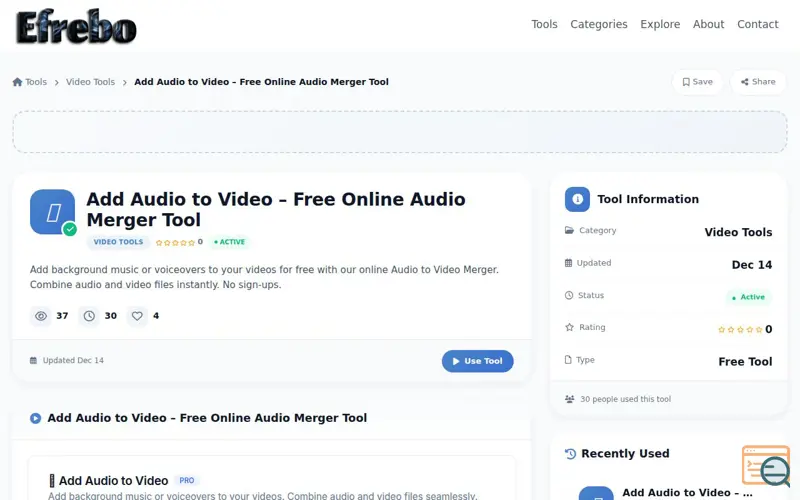 Add Audio to Video – Free Online Tool
Content
Add Audio to Video – Free Online Tool
Content
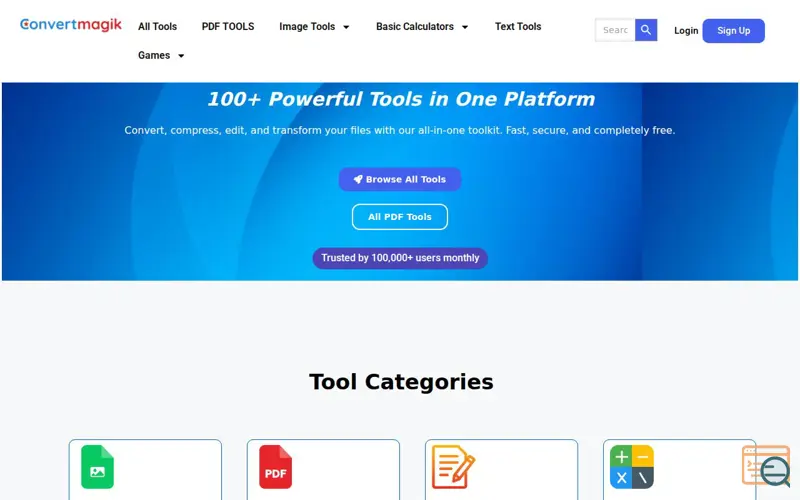 Convert Magik
Productivity
Convert Magik
Productivity



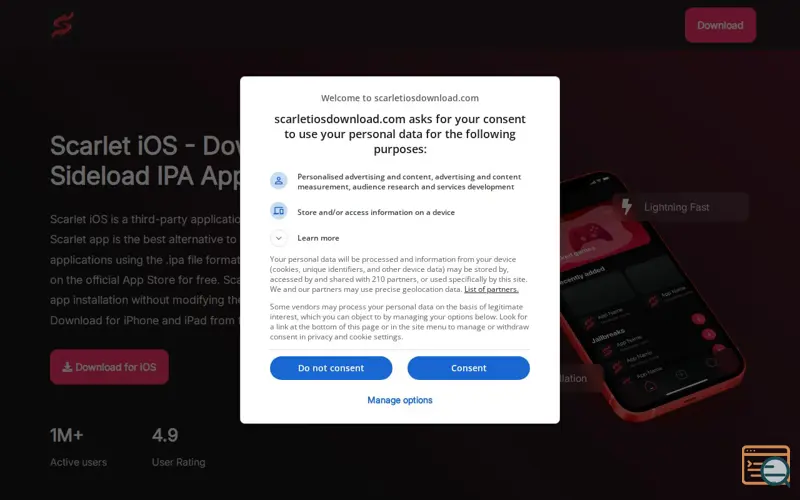 Scarlet iOS



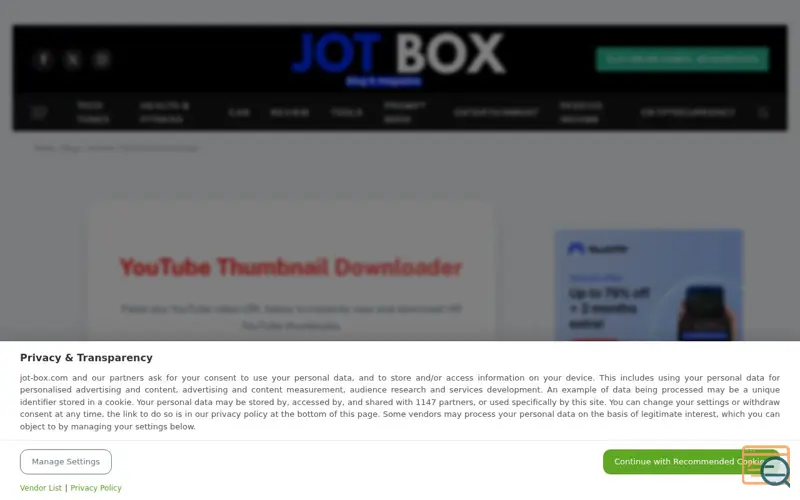 YouTube Thumbnail Downloader
Productivity
YouTube Thumbnail Downloader
Productivity


 orbitceleb.com
Content
orbitceleb.com
Content
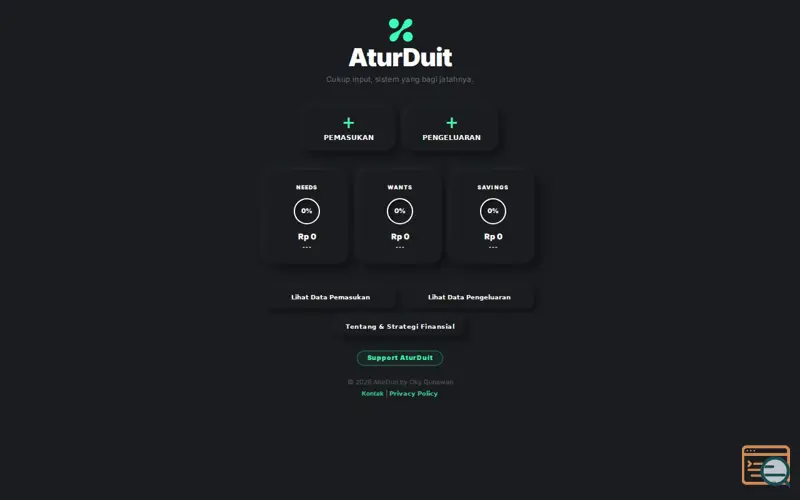 AturDuit
Finance
AturDuit
Finance
 VibeQuiz
Games
VibeQuiz
Games

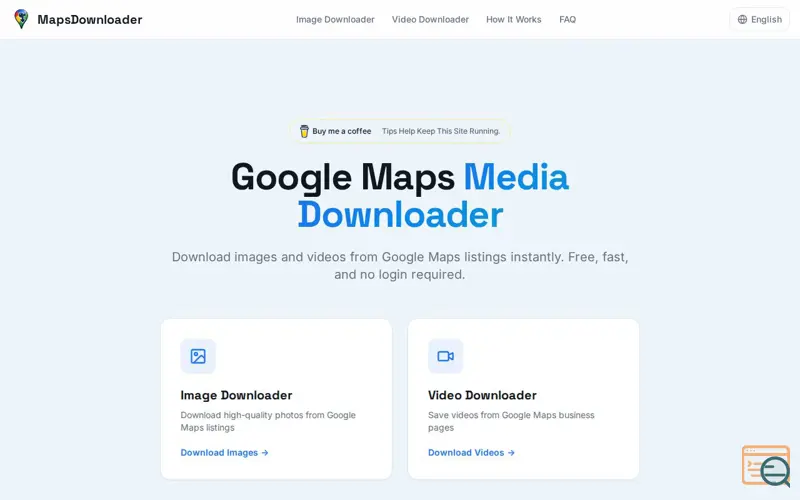 Maps Downloader
Showing the most recent 12 of 61.
The StackScope API serves all 67 sites using Profitable CPM Rate Network, filterable and exportable, from £15 a month.