Sites using TensorFlow Hub
Google repository of pre-trained machine learning models that can be loaded into TensorFlow projects.
22 sites
14 found by StackScope, 8 via launch platforms
- StackScope Discovery (Indie) 11
- StackScope Wider Web 3
- Product Hunt 4
- Hacker News 3
- PeerPush 1
TensorFlow Hub has been detected on 22 launches we've crawled. Most recent detection: gallshare — share the trip, together, 3 days ago.
It's most commonly paired with Tailwind CSS, HSTS, and Google Search Console. By product type, the launches using it are most often Health (31%), Design (15%), and Social (15%).
What kind of products ship with TensorFlow Hub
13 launches
Domain endings using TensorFlow Hub
22 sites
- .com 54.55%
- .app 22.73%
- .ai 9.09%
- .co 4.55%
- .in 4.55%
- .me 4.55%
Share of new sites using TensorFlow Hub
Each dot is one launch day. Line is the 7-day rolling average; weekly averages before June 2026.
The shaded part of the chart is measured against a different set of sites. Until 8 July 2026 we only tracked launches from launch platforms; from that date we crawl the wider web as well. The share is a proportion of whatever we were tracking at the time, so it can step at that line without the technology itself changing. For a single continuous measure, switch to launch platforms.
AI API leaders
| Tool | % of launches | % of category | ||
|---|---|---|---|---|
| #1 | ▼1 |
 Anthropic
|
0.10% | 28.39% |
| #2 | ▼1 |
 OpenAI API
|
0.06% | 18.43% |
| #3 | ▲3 |
 Abacus.AI
|
0.06% | 17.79% |
| #4 | ▼1 |
 Google Gemini API
|
0.04% | 12.03% |
| #5 | – | One API | 0.02% | 6.62% |
| … | ||||
| #32 | ▼1 | TensorFlow Hub Current page | <0.01% | 0.26% |
Percentages show adoption among indie launches: the share of all analysed launches, and of launches using any AI API tool. All 152 in AI API →
Often used with
| Tool | Launches |
|---|---|
 Tailwind CSS
|
8 |
| HSTS | 8 |
 Google Search Console
|
6 |
 Vercel
|
6 |
 Google Analytics
|
6 |
Tools most often detected on the same launches as TensorFlow Hub.
Recent launches we can show
19 of the 22 sites using TensorFlow Hub are product launches we list individually. The other 3 are sites we found crawling the wider web: they count towards the figures above, but we do not publish them one by one. How StackScope Discovery works


 InterviewFi - AI-Powered Interviews, Real Results
Hiring & HR
InterviewFi - AI-Powered Interviews, Real Results
Hiring & HR
 Excelis LMS
Education
Excelis LMS
Education


 SILIM
Health
SILIM
Health


 Eyebrowse - Shop Eyewear Online
E-commerce
Eyebrowse - Shop Eyewear Online
E-commerce
 Cost Plus PT | Self-guided movement education
Health
Cost Plus PT | Self-guided movement education
Health
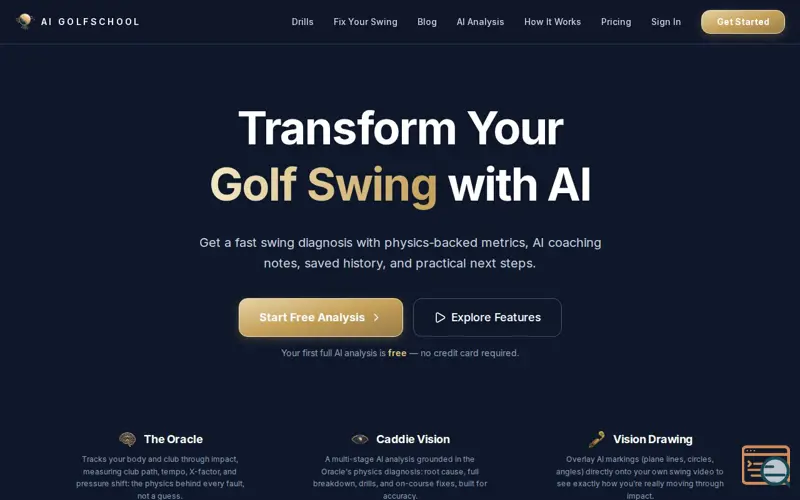 Ai Golf School
Health
Ai Golf School
Health
 IDPrintPro — Identity production, precisely managed


 Portreya

 RepBoard — Push-Up Counter
Developer Tools
FaceGrade — AI-Powered Facial Analysis
Health
AnyTalk - Free Group Video Meetings
Social
RepBoard — Push-Up Counter
Developer Tools
FaceGrade — AI-Powered Facial Analysis
Health
AnyTalk - Free Group Video Meetings
Social

Showing the most recent 12 of 19.
The StackScope API serves all 22 sites using TensorFlow Hub, filterable and exportable, from £15 a month.