
Sites built with jQuery UI
User interface widgets and effects library built on jQuery.
Found via: Product Hunt 58 · Hacker News 2 · PeerPush 10 · StackScope Discovery (Indie) 3 · StackScope Wider Web 77
Figures on this page reflect launches found via All sources only. The "Found via" counts above always show every source. Reset
jQuery UI has been detected on 73 launches we've crawled, with 12 of those in July 2026 (0.0% of the month's launches so far). The 7-day rolling share is 0.0%, roughly steady week on week. Most recent detection: Carnet, yesterday.
It's most commonly paired with Google Analytics, jQuery, and Google Search Console. By product type, the launches using it are most often Productivity (18%), Developer Tools (16%), and Marketing (12%). By estimated origin, India leads (26%), ahead of the United Kingdom (13%). By domain ending, launches using it are 1.6 times as likely as the average launch to live on a .com domain.
What kind of products ship with jQuery UI
49 launches
Countries that use jQuery UI
Estimated origin for 38 of 73 launches
-
 India
26.32%
India
26.32%
-
 United Kingdom
13.16%
United Kingdom
13.16%
-
 Germany
10.53%
Germany
10.53%
-
 Bangladesh
5.26%
Bangladesh
5.26%
-
 Brazil
5.26%
Brazil
5.26%
-
 Vietnam
5.26%
Vietnam
5.26%
-
 Australia
2.63%
Australia
2.63%
-
 Canada
2.63%
Canada
2.63%
-
 China
2.63%
China
2.63%
-
 Cyprus
2.63%
Cyprus
2.63%
-
 Israel
2.63%
Israel
2.63%
-
 South Korea
2.63%
South Korea
2.63%
-
 Luxembourg
2.63%
Luxembourg
2.63%
-
 Nigeria
2.63%
Nigeria
2.63%
Share of new launches using jQuery UI
Each dot is one launch day. Line is the 7-day rolling average.
How StackScope detects technologies
⋮ Jul 1, 2026: Adoption figures now count launches from launch platforms. Use the source view to include StackScope Discovery.
Javascript Library leaders
| Tool | % of launches | % of category | ||
|---|---|---|---|---|
| #1 |
 React Router
|
7.18% | 33.64% | |
| #2 |
 Motion
|
6.68% | 31.32% | |
| #3 |
 jQuery
|
2.93% | 13.73% | |
| #4 |
 TanStack Router
|
2.59% | 12.16% | |
| #5 |
 Zod
Zod
|
1.38% | 6.46% | |
| … | ||||
| #26 |
jQuery UI
Current page
|
0.09% | 0.41% | |
Percentages show adoption among launches found via All sources: the share of all such launches, and of those using any Javascript Library tool. All 286 in Javascript Library →
Often used with
| Tool | Launches |
|---|---|
 Google Analytics
|
57 |
|
jQuery
|
51 |
 Google Search Console
|
48 |
 Google Tag Manager
|
47 |
| HSTS | 47 |
Tools most often detected on the same launches as jQuery UI.
Most recent of 73 launches using jQuery UI found via All sources
 Carnet
Marketing
Carnet
Marketing




 Mount Roofing & Structures Pvt Ltd



 Heritage Cars London


 Hashmeta AI SEO Agents
 AI
AI




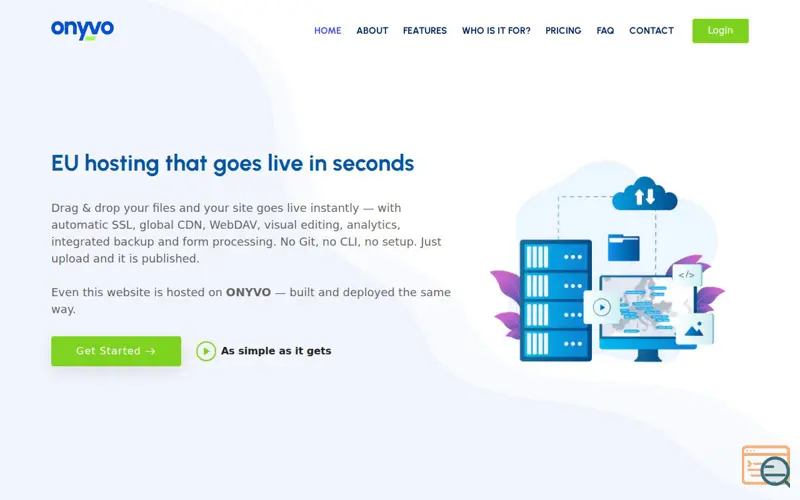 Onyvo
Onyvo
 Developer Tools

 Profesyonel İlan Scripti - Algoritma Web
 Developer Tools


 Dream Theme | Official App for Shopify
E-commerce
Dream Theme | Official App for Shopify
E-commerce


 Synology Deep Search
Productivity
Synology Deep Search
Productivity


 Astra Display | Pantallas siempre al día para tu negocio


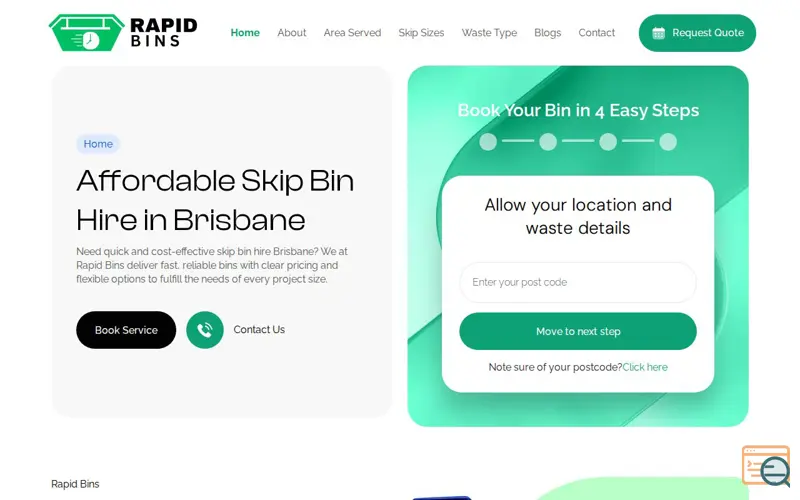 Skip Bin Hire Brisbane
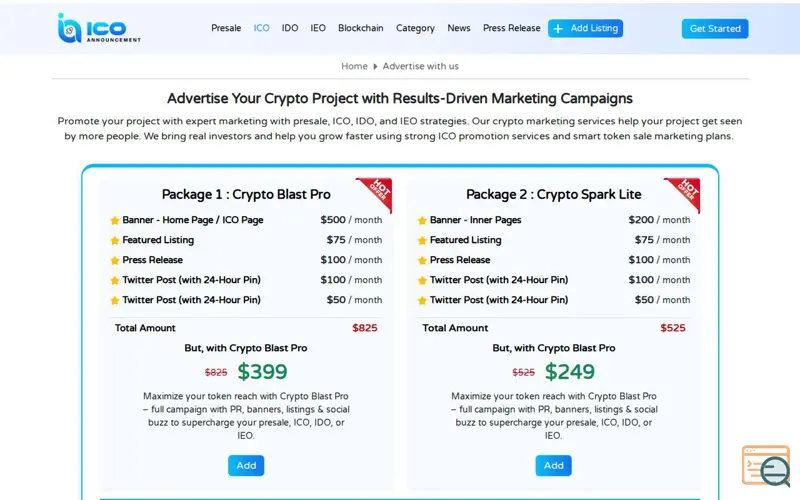 ICO Announcement



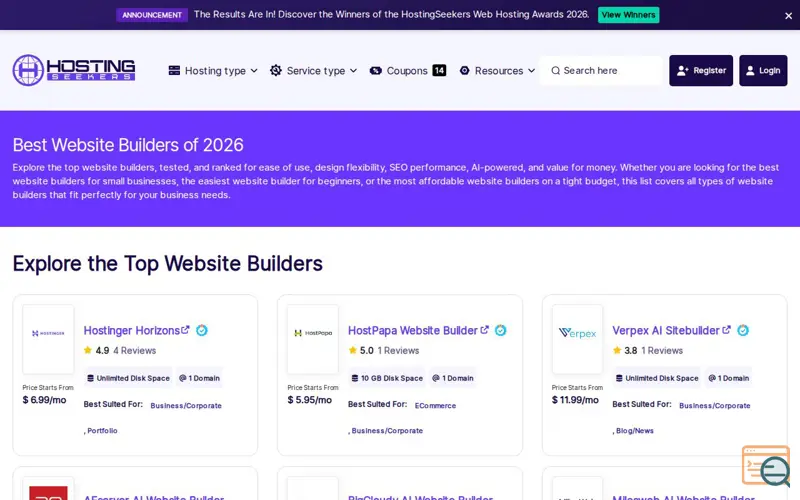 HostingSeekers
Directory
HostingSeekers
Directory

Showing the most recent 12 of 73 found via All sources.