
Sites using Storylane
Interactive product demo / guided tour embed.
Get told when a new site ships with Storylane.
Stackdar watches every launch we detect and sends you the ones using Storylane, by email, Slack or webhook. On every plan, from £15 a month.
See how alerts work48 sites
20 found by StackScope, 28 via launch platforms
- StackScope Discovery (Indie) 12
- StackScope Wider Web 8
- Product Hunt 24
- Hacker News 2
- PeerPush 2
Storylane has been detected on 48 launches we've crawled. The 7-day rolling share is 0.0%, roughly steady week on week. Most recent detection: Image & Video API, Agentic DAM, Creative Automation: Complete Visual Media Platform | ImageKit.io, today.
It's most commonly paired with Google Analytics, Google Tag Manager, and Cloudflare. By product type, the launches using it are most often Productivity (24%), Marketing (21%), and Developer Tools (15%).
What kind of products ship with Storylane
34 launches
Domain endings using Storylane
46 sites
- .ai 21.74%
- .io 21.74%
- .com 17.39%
- .app 10.87%
- .uk 6.52%
- .au 2.17%
- .ca 2.17%
- .cloud 2.17%
- .co 2.17%
- .dev 2.17%
Share of new sites using Storylane
Each dot is one launch day. Line is the 7-day rolling average; weekly averages before June 2026.
The shaded part of the chart is measured against a different set of sites. Until 8 July 2026 we only tracked launches from launch platforms; from that date we crawl the wider web as well. The share is a proportion of whatever we were tracking at the time, so it can step at that line without the technology itself changing. For a single continuous measure, switch to launch platforms.
Product Demos leaders
| Tool | % of launches | % of category | ||
|---|---|---|---|---|
| #1 |
 Supademo
|
<0.01% | 51.66% | |
| #2 |
Storylane
Current page
|
<0.01% | 22.75% | |
| #3 | Guideflow | <0.01% | 7.11% | |
| #4 | Navattic | <0.01% | 6.16% | |
| #5 | Adora | <0.01% | 1.90% |
Percentages show adoption among indie launches: the share of all analysed launches, and of launches using any Product Demos tool. All 27 in Product Demos →
Often used with
| Tool | Sites |
|---|---|
 Google Analytics
|
35 |
 Google Tag Manager
|
33 |
 Cloudflare
|
30 |
| HSTS | 30 |
 Google Search Console
|
29 |
Tools most often detected on the same sites as Storylane.
Recent launches we can show
40 of the 48 sites using Storylane are product launches we list individually. The other 8 are sites we found crawling the wider web: they count towards the figures above, but we do not publish them one by one. How StackScope Discovery works




 Life Path Guide



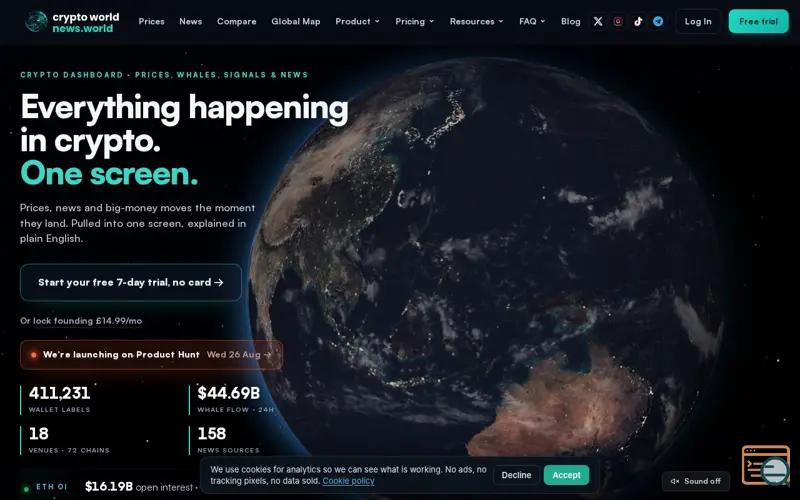 CryptoWorld News
 Crypto



 Service Monitor Adapt | Guest Feedback Software for Hospitality & Leisure
Productivity
Service Monitor Adapt | Guest Feedback Software for Hospitality & Leisure
Productivity



 Bidding Brain | AI Tender Knowledge & Bid Intelligence


 Sales Playbook Builder — Your Reps Are Out There Right Now. Winging It.
Marketing
Sales Playbook Builder — Your Reps Are Out There Right Now. Winging It.
Marketing
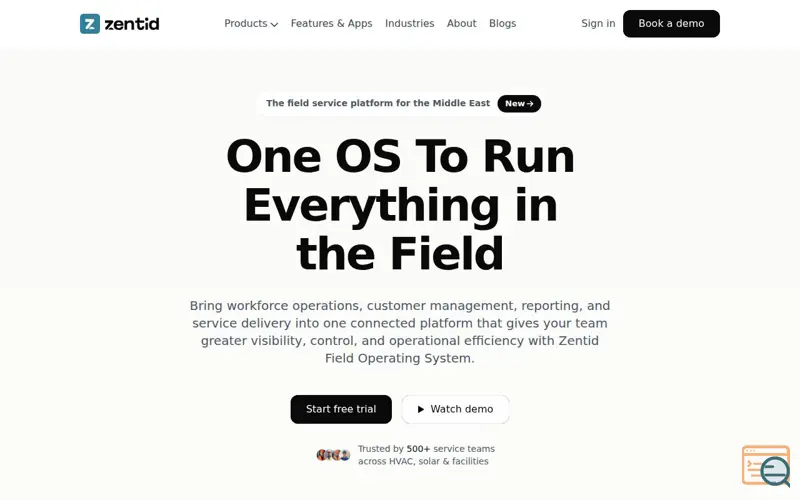 Zentid
 Productivity

 Evant
Evant
 Marketing


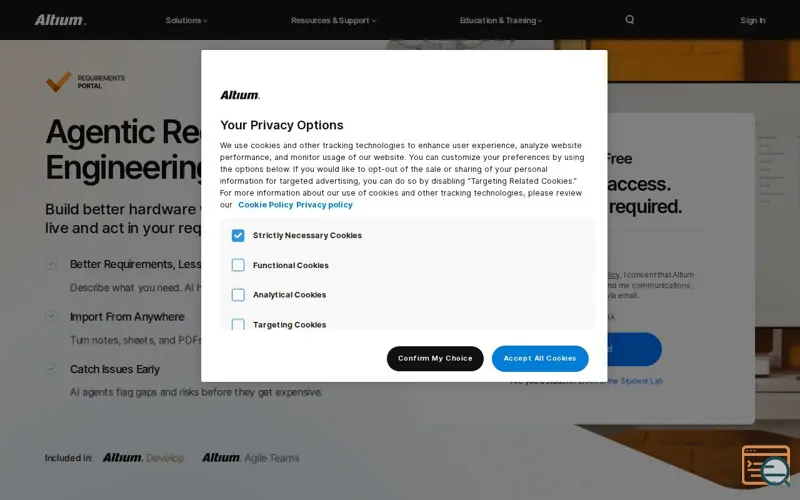 Agentic Requirements Engineering


 setea — el setter de IA para coaches y profesionales
Marketing
setea — el setter de IA para coaches y profesionales
Marketing


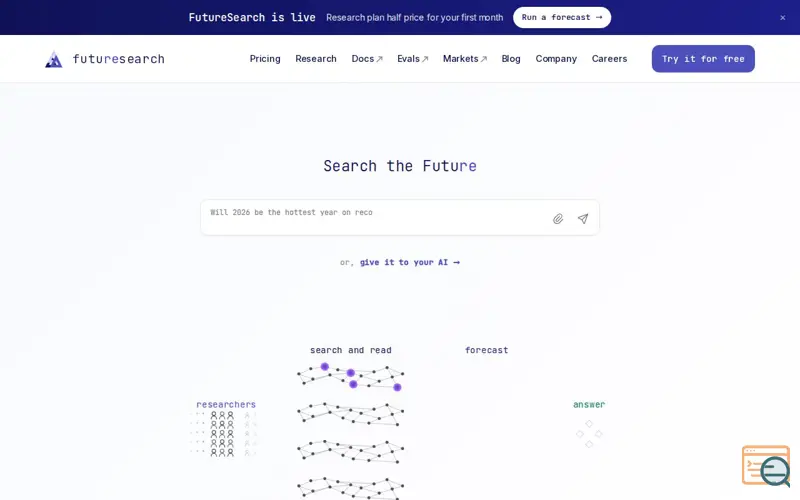 Futuresearch
AI
Futuresearch
AI
 Vexa — Software para Clínicas com IA e Secretária no WhatsApp


Showing the most recent 12 of 40.
The StackScope API serves all 48 sites using Storylane, filterable and exportable, from £15 a month.