Sites using TrackDesk
Affiliate marketing and partner tracking platform
24 sites
14 found by StackScope, 10 via launch platforms
- StackScope Discovery (Indie) 10
- StackScope Wider Web 4
- Product Hunt 9
- PeerPush 1
TrackDesk has been detected on 24 launches we've crawled. Most recent detection: PropCloser — AI Transaction Coordinator for Real Estate, 3 days ago.
It's most commonly paired with Google Analytics, Tailwind CSS, and HTTP/3. By product type, the launches using it are most often Marketing (33%), Finance (19%), and Productivity (19%).
What kind of products ship with TrackDesk
21 launches
Domain endings using TrackDesk
24 sites
- .com 50.00%
- .online 12.50%
- .ai 8.33%
- .app 8.33%
- .co 8.33%
- .io 4.17%
- .it 4.17%
Share of new sites using TrackDesk
Each dot is one launch day. Line is the 7-day rolling average; weekly averages before June 2026.
The shaded part of the chart is measured against a different set of sites. Until 8 July 2026 we only tracked launches from launch platforms; from that date we crawl the wider web as well. The share is a proportion of whatever we were tracking at the time, so it can step at that line without the technology itself changing. For a single continuous measure, switch to launch platforms.
Affiliate leaders
| Tool | % of launches | % of category | ||
|---|---|---|---|---|
| #1 | ▲1 |
 Amazon Affiliate Links
|
0.17% | 32.66% |
| #2 | ▲1 |
 ValueCommerce
|
0.13% | 25.91% |
| #3 | ▲1 |
 Moshimo
|
0.13% | 25.10% |
| #4 | ▼3 |
 Impact
|
0.11% | 20.63% |
| #5 | – |
 Rewardful
|
0.04% | 8.64% |
| … | ||||
| #53 | ▼12 | TrackDesk Current page | <0.01% | 0.17% |
Percentages show adoption among indie launches: the share of all analysed launches, and of launches using any Affiliate tool.Among August launches it ranked #54 in Affiliate, down from #42 in July. All 242 in Affiliate →
Often used with
| Tool | Sites |
|---|---|
 Google Analytics
|
20 |
 Tailwind CSS
|
19 |
| HTTP/3 | 19 |
 Google Search Console
|
17 |
 Google Tag Manager
|
17 |
Tools most often detected on the same sites as TrackDesk.
Recent launches we can show
20 of the 24 sites using TrackDesk are product launches we list individually. The other 4 are sites we found crawling the wider web: they count towards the figures above, but we do not publish them one by one. How StackScope Discovery works



 Nobu - SEO Autopilot & Content Writer
AI
Nobu - SEO Autopilot & Content Writer
AI



 AI Mimic Motion - Any Character, Any Motion | AnyMimic
AI
PropCloser — AI Transaction Coordinator for Real Estate
Finance
Markitdown Online - Convert Word, PDF to Markdown | FiletoMD
Productivity
Img2threejs - Convert Images to Three.js Models
Developer Tools
AnyDoc Online – Convert Any Document to Markdown for AI
Productivity
PDF Inspector Online – Analyze and Convert PDF to Markdown
Productivity
AI Mimic Motion - Any Character, Any Motion | AnyMimic
AI
PropCloser — AI Transaction Coordinator for Real Estate
Finance
Markitdown Online - Convert Word, PDF to Markdown | FiletoMD
Productivity
Img2threejs - Convert Images to Three.js Models
Developer Tools
AnyDoc Online – Convert Any Document to Markdown for AI
Productivity
PDF Inspector Online – Analyze and Convert PDF to Markdown
Productivity

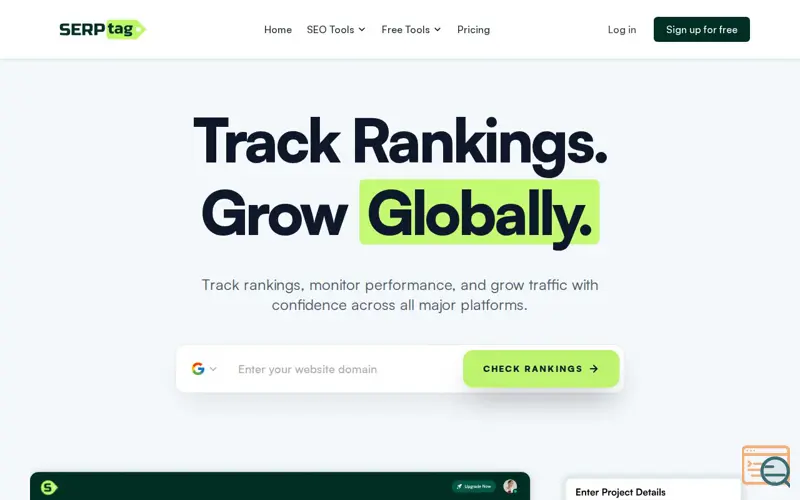 SERPtag
Marketing
SERPtag
Marketing

 Mybirds
Social
Mybirds
Social


 Codex Theme - Customize Your Chatgpt App theme
AI
Codex Theme - Customize Your Chatgpt App theme
AI
 Unlimited OCR Online- Extract Text with PDF OCR
Productivity
Unlimited OCR Online- Extract Text with PDF OCR
Productivity
Showing the most recent 12 of 20.
The StackScope API serves all 24 sites using TrackDesk, filterable and exportable, from £15 a month.