Sites using Gartner Peer Insights
Enterprise software review platform where verified users rate and review vendors.
18 sites
2 found by StackScope, 16 via launch platforms
- StackScope Discovery (Indie) 2
- Product Hunt 15
- PeerPush 1
Gartner Peer Insights has been detected on 18 launches we've crawled, with 11 of those in September 2026 (0.0% of the month's launches so far). Most recent detection: PEP & RCA Screening, today.
It's most commonly paired with Google Analytics, Google Tag Manager, and Cloudflare. By product type, the launches using it are most often Finance (36%), Developer Tools (27%), and Marketing (18%). The 16 scored launches using Gartner Peer Insights average a StackScope score of 9.1 out of 10, against 6.4 across all launches we score.
What kind of products ship with Gartner Peer Insights
11 launches
Domain endings using Gartner Peer Insights
18 sites
- .com 83.33%
- .io 11.11%
- .co 5.56%
Share of new sites using Gartner Peer Insights
Each dot is one launch day. Line is the 7-day rolling average; weekly averages before June 2026.
The shaded part of the chart is measured against a different set of sites. Until 8 July 2026 we only tracked launches from launch platforms; from that date we crawl the wider web as well. The share is a proportion of whatever we were tracking at the time, so it can step at that line without the technology itself changing. For a single continuous measure, switch to launch platforms.
Social Proof leaders
| Tool | % of launches | % of category | ||
|---|---|---|---|---|
| #1 | – | Saudi Business Center | 0.04% | 34.40% |
| #2 | – | Better Business Bureau | 0.02% | 12.83% |
| #3 | ▼2 |
 G2
G2
|
0.01% | 5.92% |
| #4 | ▲3 |
 Entangle Commerce
|
0.01% | 4.59% |
| #5 | – |
 SociableKIT
|
0.01% | 4.09% |
| … | ||||
| #36 | ▼35 | Gartner Peer Insights Current page | <0.01% | 0.35% |
Percentages show adoption among indie launches: the share of all analysed launches, and of launches using any Social Proof tool.Among August launches it ranked #72 in Social Proof, down from #37 in July. All 234 in Social Proof →
Often used with
| Tool | Sites |
|---|---|
 Google Analytics
|
18 |
 Google Tag Manager
|
18 |
 Cloudflare
|
17 |
 Google Ads
|
17 |
 Google Workspace
|
16 |
Tools most often detected on the same sites as Gartner Peer Insights.
Recent launches we can show
18 of the 18 sites using Gartner Peer Insights are product launches we list individually.
 PEP & RCA Screening
Finance
PEP & RCA Screening
Finance




 Sanctions Screening
 Deepfake Detection
 Age Verification
 Geo Location Compliance
 Shufti AI
 Shufti MCP Connector
AI
Shufti MCP Connector
AI
 Journey Builder
Developer Tools
Journey Builder
Developer Tools
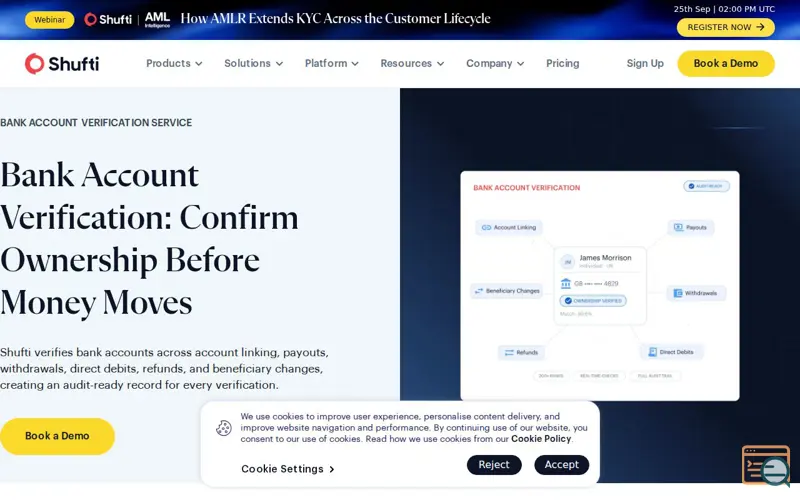 Bank Account Verification
Finance
Bank Account Verification
Finance
 Crypto Travel Rule Compliance
 IntelloSync
 Productivity




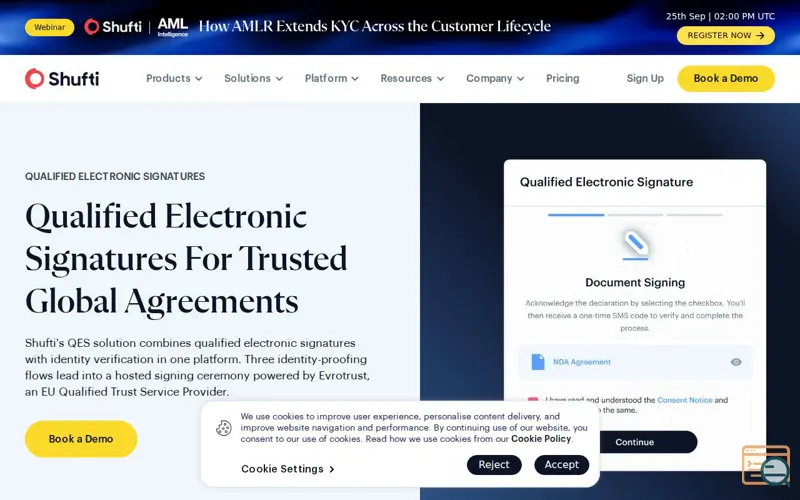 Qualified Electronic Signatures
Showing the most recent 12 of 18.
The StackScope API serves all 18 sites using Gartner Peer Insights, filterable and exportable, from £15 a month.