Optimizely on new websites
A/B testing, experimentation, and digital experience platform for marketing and product teams.
629 sites
619 found by StackScope, 10 via launch platforms
- StackScope Wider Web 617
- StackScope Discovery (Indie) 2
- Product Hunt 9
- Hacker News 1
Optimizely appeared on about 190 new sites in the last 30 days.
These figures cover websites that went live since April 2026, not the web as a whole.
Get told when a new site ships with Optimizely.
187 new sites with Optimizely first seen in the last 30 days.
Stackdar watches every launch we detect and sends you the ones using Optimizely, by email, Slack or webhook. On every plan, from £15 a month.
See how alerts workShare of new sites using Optimizely
Each dot is one launch day. Line is the 7-day rolling average; weekly averages before July 2026. Chart starts at first detection.
The shaded areas were measured against a different set of sites, so the line can step there without Optimizely itself changing.
Coverage details
Before the dashed line where the dots begin, the line is a weekly average. After it, the last 90 days are shown one day at a time.
Grey: before 8 July 2026, we only tracked launches from launch platforms. From that date we crawl the wider web as well.
Amber: 8 July to 10 September 2026, before we improved our infrastructure to index new sites much sooner, often on the day they go live. Sites found that early often haven't finished setting up, so anything usually added after launch reads lower from 10 September. We record each site as it was when we found it.
The share is a proportion of whatever we were tracking at the time. For a single continuous measure, switch to launch platforms.
What kind of sites use Optimizely
84 sites with a known type, all time
Domain endings using Optimizely
629 sites, all time
- .com 72.0%
- .nz 7.8%
- .uk 3.7%
- .net 2.4%
- .org 1.9%
- .store 1.8%
- .ca 1.6%
- .co 1.6%
- .au 1.4%
- .live 1.0%
- .art 0.6%
Country
Country likely for 101 of 629 sites (16.1%), all time.
How we know
Country comes from what each site says about itself, such as a company registration, legal terms or a phone number, not just its domain ending. Too few sites state their country plainly for the usual count, so this one also counts single signals: a country domain ending, a phone number (for North America, its area code), a location the site declares in its own page metadata, or a country-specific vendor stack and the page language where they agree and nothing contradicts them. Read these as likely rather than certain.
-
 United States
36.6%
United States
36.6%
-
 United Kingdom
21.8%
United Kingdom
21.8%
-
 Japan
9.9%
Japan
9.9%
-
 Australia
8.9%
Australia
8.9%
-
 Germany
5.0%
Germany
5.0%
-
 New Zealand
5.0%
New Zealand
5.0%
-
 Canada
4.0%
Canada
4.0%
-
 Czechia
4.0%
Czechia
4.0%
-
 Sweden
3.0%
Sweden
3.0%
-
 Israel
1.0%
Israel
1.0%
-
 Netherlands
1.0%
Netherlands
1.0%
Analytics leaders
| Tool | % of sitesall time | % of categoryall time | ||
|---|---|---|---|---|
| #1 | – |
 Google Analytics
|
10.4% | 43.3% |
| #2 | – |
 Tinybird
|
3.7% | 15.6% |
| #3 | ▼1 |
 Cloudflare Web Analytics
|
2.5% | 10.4% |
| #4 | ▲1 |
 Sourcebuster
|
2.5% | 10.4% |
| #5 | – |
 Vercel Analytics
|
1.7% | 6.9% |
| … | ||||
| #57 | ▼3 |
Optimizely
Current page
|
<0.1% | <0.1% |
Percentages show all-time adoption across the new sites we track: the share of all of them, and of the sites using any Analytics tool.Optimizely is typically used alongside Google Analytics rather than instead of it.Among September launches it ranked #56 in Analytics, down from #53 in August. All 1486 in Analytics →
Often used with
| Tool | Sites | vs all new sites |
|---|---|---|
 Google Ads
|
301 | 18x |
 Facebook Pixel
|
285 | 13x |
 Google Tag Manager
|
503 | 6.8x |
|
Google Analytics
|
382 | 5.9x |
 Next.js
|
274 | 3.1x |
Tools that turn up far more often on Optimizely sites than on new sites in general, and how many times as common each one is there.
Recent launches using Optimizely
12 of the 629 sites using Optimizely are product launches we list individually. The other 617 are sites we found crawling the wider web: they count towards the figures above, but we do not publish them one by one. They are included in the StackScope API and in Stackdar alerts. How StackScope Discovery works




 CodeSpotlight
Sep 22, 2026 · score 9.1 · Developer Tools
Also detected
CodeSpotlight
Sep 22, 2026 · score 9.1 · Developer Tools
Also detected




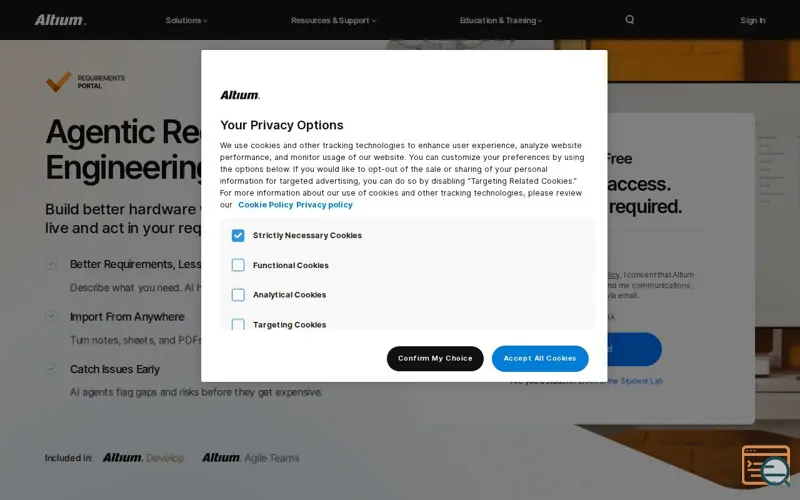 Agentic Requirements Engineering
Also detected
Agentic Requirements Engineering
Also detected



 Enterprise Maintenance, Powered by Intelligence
Also detected
Enterprise Maintenance, Powered by Intelligence
Also detected



 Loglens
Also detected
Loglens
Also detected



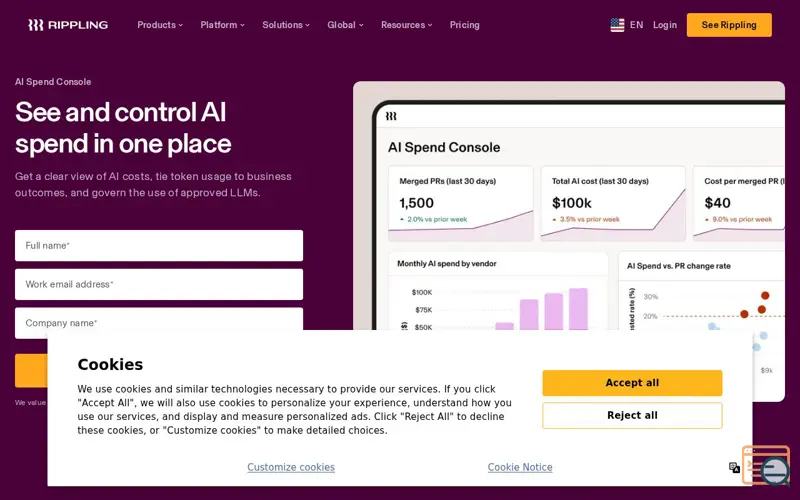 AI Spend Console by Rippling
Also detected
AI Spend Console by Rippling
Also detected

 AI-Native Contract Intelligence
Also detected
AI-Native Contract Intelligence
Also detected
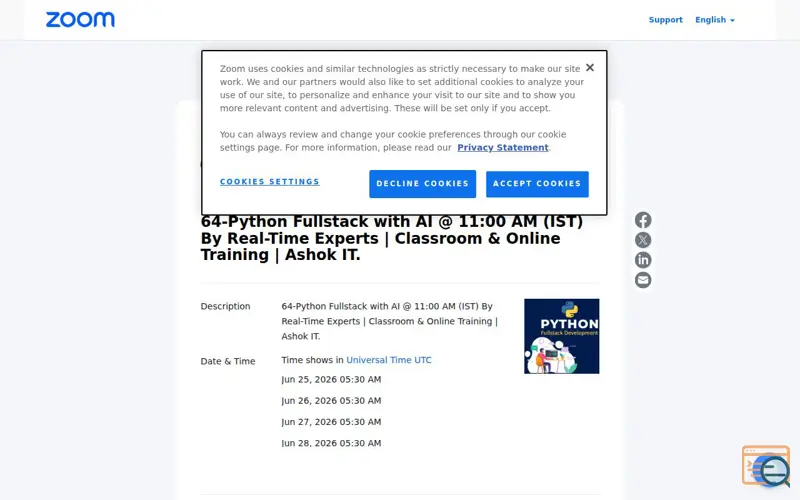 Python Full Stack with AI
Also detected
Python Full Stack with AI
Also detected

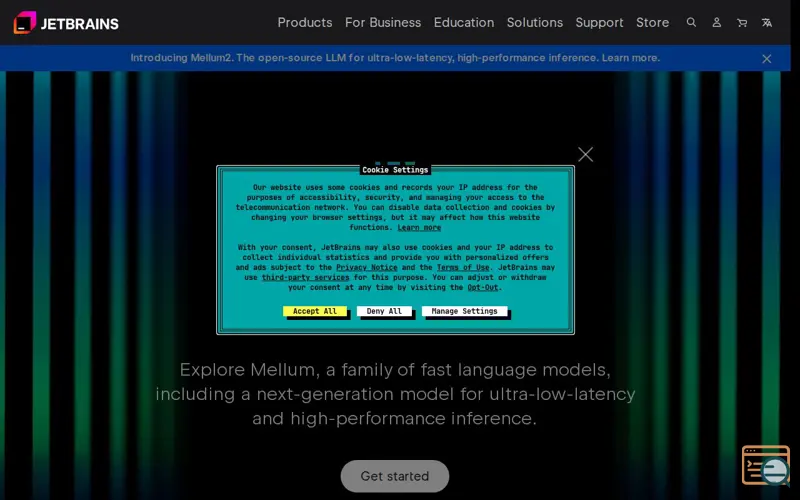 Mellum by JetBrains
Jun 20, 2026 · score 9.1 · AI
Also detected
Mellum by JetBrains
Jun 20, 2026 · score 9.1 · AI
Also detected



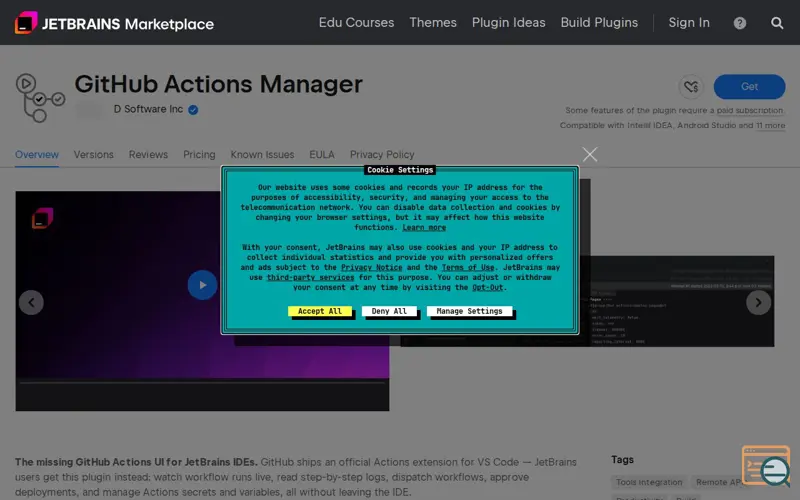 GitHub Actions Manager
Jun 12, 2026 · score 9.1 · Developer Tools
Also detected
GitHub Actions Manager
Jun 12, 2026 · score 9.1 · Developer Tools
Also detected

 Mixpanel Headless
Also detected
Mixpanel Headless
Also detected


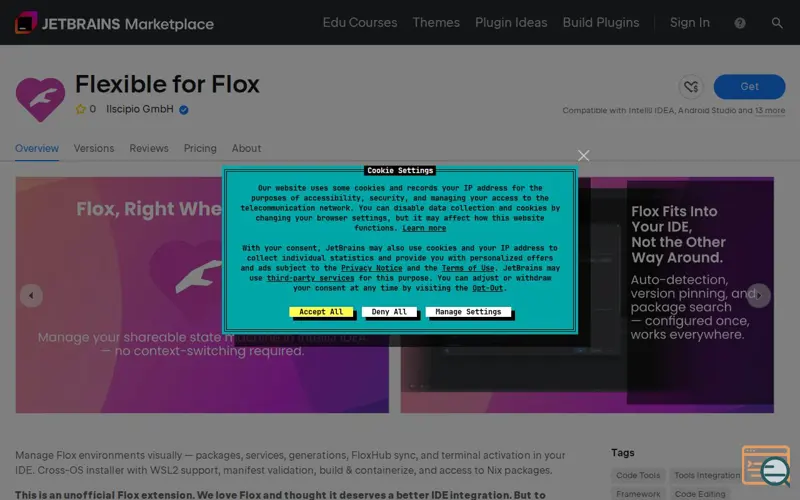 Flox in your Jetbrains IDE
May 13, 2026 · score 9.1 · Developer Tools
Also detected
Flox in your Jetbrains IDE
May 13, 2026 · score 9.1 · Developer Tools
Also detected
The StackScope API serves all 629 sites using Optimizely, filterable and exportable, from £15 a month.